The SAP Reporting dashboard shows information about the content repository usage within a defined time period.
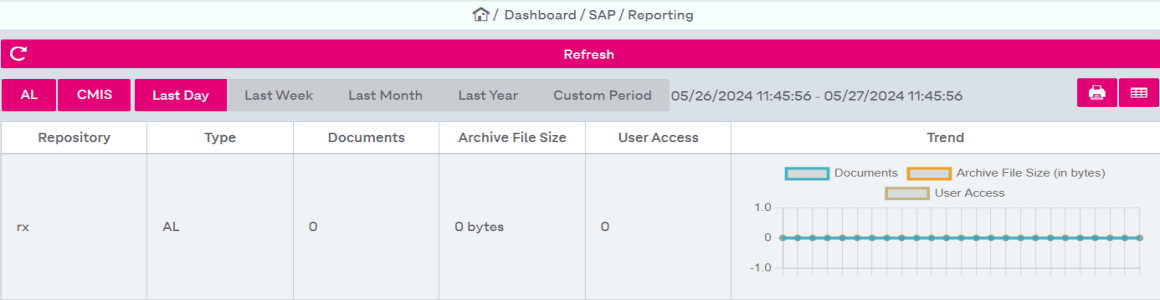
Figure 274: Dashboard – SAP: reporting
The following information is displayed:
-
Repository: the content repository name
-
Type: the type of the content repository (either Archive Link or CMIS)
The repositories can be filtered by type in the upper functional filter panel
-
Documents: the number of documents
-
Archive File Size: the file size that is used in the archive
-
User Access: the number of all operations (get, getDoc, info, ...) executed by a user
-
Trend: the trend within the selected time period shown in an area chart
The list can be filtered by the type of the content repository. The following options are supported:
-
AL (Archive Link)
-
CMIS
The used time period is shown in the upper area located alongside the time period options:
-
Last Day: the last 24 hours
-
Last Week: the last 7 days
-
Last Month: the last month
-
Last Year: the last year
-
Custom Period: a period that can be set with date/time pickers (also see Date / time pickers)
The following actions are available in the SAP reporting dashboard:
-
 “Print Current Value Set” prints the calculated numbers that are presented in a table.
 -
 “Export Current Value Set to Excel” creates an Excel file that can be downloaded.